Starting from the Dashboard
To display the Dashboard at any time, click Dashboard on the main menu. The
The Dashboard has two sections or areas:
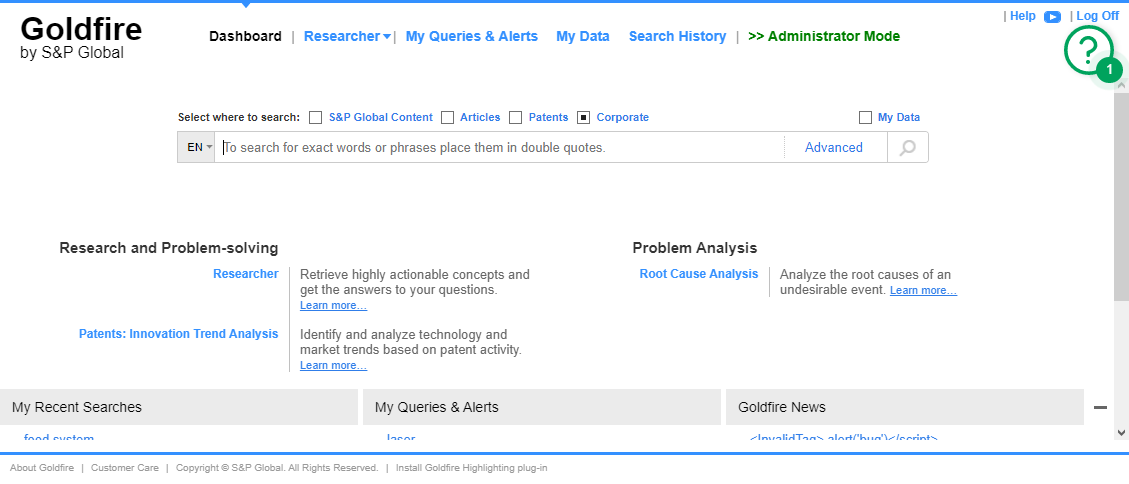
- Query area. The query box is always displayed on the Dashboard.
-
Researcher. This tool enables you to retrieve highly actionable concepts and get answers to your questions.
-
Patents: Innovation Trend Analysis. This tool enables you to identify and analyze technological and market trends based on patent activity.
-
Root Cause Analysis. This tool enables you to analyze the root causes of undesirable events.
- Customized access to external websites and application. It is possible that your Goldfire administrator, on behalf of your organization, has customized your dashboard so that you can access external websites and web applications that serve as additional corporate resources. If this is the case, you will see the names of these websites or applications under the query box. Click on one of these hyperlinks to open a separate window that takes you to an external site or application.
Which of these tools is available depends on the type of license you are associated with.
- Gadget area, which comprises the following gadgets:
-
My Recent Searches. This gadget displays a list of queries that you have recently submitted.
- My Queries & Alerts. This gadget displays a list of your scheduled queries that have returned new results since the last time that you checked.
-
To collapse the gadget area, click  .
.
To expand the gadget area, click  .
.
The query area of the Dashboard looks like this:
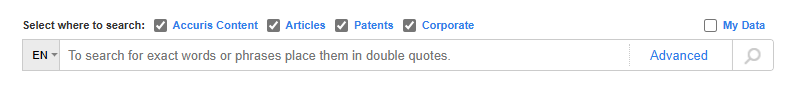
Select Where to Search - enables
you to select what
My Subscriptions. Enables you to refine your search to Accuris sources that are a part of your subscription. If you are logged into Goldfire and you are also logged into an Engineering Workbench account, you can select this check box when conducting a query to display search results with Accuris sources that are part of your subscriptions. When the My Subscriptions check box is selected, Accuris sources related to your query that are not part of your subscriptions are not displayed.
Query box, where you type natural language queries. Goldfire provides a list of suggestions and possible corrections as you type.
 (Language) (if the Language Pack is installed) Enables you to specify the language of your query.
Advanced. Enables you to enter a more complex query.
You should always use the Advanced Search feature to search by metadata such as title, author, publication date, or publication number. Results will be more reliable than they would be if you included such metadata information as keywords in the main query box.
![]() . Begins the search.
. Begins the search.
Goldfire provides users with a set of cognitive search features that enhance and better support your search experience. Content must be indexed (or reindexed if already indexed) for the following cognitive search features to take effect:
-
Boolean-Free Searching: Enables users to search all metadata associated with documents without Boolean operands. This means that users do not need to type <and> and <in> operands in their searches. Examples of fields to which you might apply Boolean-free searching are: file name, file extension, and other high-importance fields. Users simply type keywords and Goldfire returns relevant matches.
The exception to Boolean-free searching is queries related to dates, which requires the use of Boolean operands.
-
Wildcard Searching: Enables users to replace characters in the words of their query with an asterisk (*). You can use the wildcard mode of searching to search for metadata associated with the documents. Examples of fields to which you might apply wildcard searching are: file name, folder, document type, etc.
Wildcard searching does not apply to searching for content within the document body. However, a number of filter categories exist to address this, and enable you to search for metadata from within document body that is extracted by natural language processing technology.
- Improved PDF Searching: Goldfire detects and categorizes the content of a PDF document into logical fields (Table, Figure, etc.), which enables users perform more effective queries by using these fields as advanced filters in the query.
Goldfire enables you to target your query to an exact term or phrase when you contain the contents of your search within quotation marks. This search capability allows you to conduct queries with precision. Documents with content in the document title and/or in the document body that exactly matches your query are returned in the results list. Furthermore, this search capability is enabled for all the languages that are supported by Goldfire. If you want take full advantage of the exact search functionality as you search for relevant documents in your existing corporate and personal knowledge bases, then it is necessary to rebuild them.
Displays a list of up to seven queries that you have recently submitted.
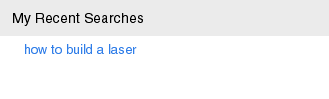
- To rerun a recently run query, click it.
- To view the full text of a query, move the mouse over the query name.
- To display all of your recent queries, click See All.
You can save queries for later use, and you can schedule specified queries to run periodically. My Queries & Alerts lists the names of up to five scheduled queries that have new results. Only alerts for queries that returned new results are shown.
- To view the new results, click the name of the alert.
- To view all of your alerts, click See All.
- To edit your saved queries, click Manage.
- To view all results for a query (not just new results), click Manage, and then click Run Now next to your query.